Constructivist
Learning Environments in a Cross-National Study in Taiwan and Australia
Jill M. Aldridge, Barry J. Fraser and Peter C.
Taylor, Science and Mathematics Education Centre, Curtin University of
Technology, Perth
Chung-Chi Chen, National Kaohsiung Normal University,
Taiwan
This article focuses on
the validation and use of English and Chinese versions of the Constructivist
Learning Environment Survey (CLES) in a cross-national study of high
school science classrooms in Australia and Taiwan. The CLES was administered to
1081 students from 50 classes in Australia and 1879 students from 50 classes in
Taiwan. Data analysis supported each scale’s internal consistency reliability,
factor structure and ability to differentiate between classrooms, and revealed
interesting differences between average scale scores in Taiwan and Australia.
The questionnaire data were used to guide the collection of qualitative data in
each country to explain patterns and differences in mean scale scores in
Australia and Taiwan. Interviews with students also provided precautionary
information regarding students’ understanding of some items and the use of a
Western survey to measure constructivist learning environments in an Eastern
country.
Educational research which crosses national boundaries offers much
promise for generating new insights for at least two reasons (Brislin, 1983;
Fraser, 1996a; Stigler & Hiebert, 1997). First, the range and variation in
variables of interest (e.g. teaching methods, student attitudes) is frequently
greater in a sample drawn from multiple countries than from a one-country
sample. Second, the taken-for-granted familiar educational practices, beliefs
and attitudes in one country can be exposed, made 'strange' and questioned when
researchers from two countries collaborate on research involving teaching and
learning in two countries.
The present research is one of the few cross-national studies
undertaken in science education. It involved six Australian and seven Taiwanese
science education researchers in working together on a cross-national study of
learning environments in Taiwan and Australia. The study involved the
validation of English and Mandarin versions of a learning environment
questionnaire and a comparison of classroom learning environments in Taiwan and
Australia. As well, it investigated determinants and effects of learning
environment in these two countries. This article is organised into four
sections: background; method; findings; and discussion and conclusions.
Background
Learning Environment Research
Considerable progress has been made over the past 30 years in the
conceptualisation, assessment and investigation of the important but subtle
concept of learning environment (Fraser, 1986, 1994, 1998; Fraser &
Walberg, 1991; McRobbie & Ellett, 1997; Wubbels & Levy, 1993). Some
highlights from the field of classroom environment include (1) the use of
qualitative methods in learning environment research (Tobin, Kahle &
Fraser, 1990), including the combination of quantitative and qualitative
methods (Fraser & Tobin, 1991; Tobin & Fraser, 1998), (2) the
development of preferred forms of instruments which permit investigations of
differences between actual and preferred classroom environments (Fisher &
Fraser, 1983) and person-environment fit studies of whether students achieve
better in their preferred classroom environment (Fraser & Fisher, 1983),
(3) teachers’ use of assessments of actual and preferred classroom environment
in action research attempts to improve their classrooms (Fraser & Fisher,
1986), (4) the incorporation of learning environment ideas into teacher
education (Fraser, 1993) and school psychology (Burden & Fraser, 1993), and
(5) the idea of ‘grain sizes’ in learning environment research (Fraser, 1996b).
The Constructivist Learning Environment Survey
The Constructivist
Learning Environment Survey (CLES; Taylor, Dawson & Fraser,
1995a, 1995b; Taylor, Fraser & Fisher, 1997) was developed to enable
educators and researchers to measure students’ perceptions of the extent to
which constructivist approaches are present in classrooms. The original version
of the CLES (Taylor & Fraser, 1991) was based largely on a psychosocial
view of constructivist reform that focused on students as co-constructors of
knowledge. Although the original version of the CLES was used within Australian
high schools and in other countries (Lucas & Roth, 1996; Roth & Bowen,
1995, Watters & Ginns, 1994) and found to be reliable, the theoretical
framework supporting the survey was found to be weak (Fraser, Dryden &
Taylor, 1998).
A new version of the CLES was developed from the perspective of critical
constructivism (Taylor, 1996) to recognise socio-cultural
constraints to the cognitive constructive activity of the individual learner
and thereby strengthening weaknesses in the original version. The new version
of the CLES was designed to obtain measures of five key elements of a critical
constructivist learning environment from the students’ perception: the degree
of personal relevance in their studies; whether students have shared control
over their learning; the degree to which students feel free to express concerns
about their learning; the degree to which students are able to interact with
each other to improve their understanding; and the extent to which science is
viewed as ever changing (Taylor, Dawson & Fraser, 1995a; Taylor, Fraser
& Fisher, 1997).
This new version of the CLES was trialled in two classroom-based
collaborative research studies (Taylor, Dawson & Fraser, 1995a, 1995b;
Taylor, Fraser & White, 1994). The conceptual strength and psychometric
structure of the questionnaire were rigorously tested using quantitative and
qualitative methods. These studies led to modifications in the survey to
enhance comprehensibility by omitting negative items and those items considered
‘conceptually complex’. In addition, the survey departed from traditional
measures of the learning environment by grouping together items of the same
scale and including a simple scale name that would provide students with a
contextual cue (rather than arranging the items from a given scale randomly or
cyclically throughout the questionnaire).
Method
Quantitative Data Collection
In this study qualitative and quantitative methods were combined as
recommended by Fraser and Tobin (1991) and Tobin and Fraser (1998). The Constructivist
Learning Environment Survey (CLES) was used to assess:
·
Personal Relevance (extent to which teachers relate science to students out-of-school
experiences).
·
Student Negotiation (extent to which opportunities exist for students to explain and
justify to other students their newly developing ideas and to listen and
reflect on the viability of other students’ ideas).
·
Shared Control (extent to which students are invited to share with the teacher
control of the learning environment, including the articulation of their own
learning goals, design and management of their learning activities and
determining and applying assessment criteria).
·
Critical Voice (extent to which a social climate has been established in which
students feel that it is legitimate and beneficial to question the teacher’s
pedagogical plans and methods and to express concerns about any impediments to
their learning).
·
Uncertainty (the
extent to which opportunities are provided for students to experience
scientific knowledge as arising from theory dependent inquiry, involving human
experience and values, evolving and non-foundational, and culturally and
socially determined).
There are six items in each scale with a total of 30 items with a
five-point response scale of Almost Always, Often, Sometimes, Seldom and Almost
Never. Appendix 1 lists the items in the CLES.
In order to permit investigation of association between classroom
environment and student outcomes, an eight-item scale was used to assess
students’ satisfaction in terms of enjoyment, interest and how much they look
forward to science classes. This was based on a scale from the Test of
Science Related Attitudes (TOSRA; Fraser, 1981).
The instruments were translated into Chinese by team members based in
Taiwan. The next step involved an independent back translation of the Chinese
version into English again by other team members who were not involved in the
original translation. Then, the Australian researchers checked the back translations
and, for some items, it was necessary to modify the original English version,
the Chinese translation, or both. For example, difficulties finding an
equivalent word for ‘inventing’ in the context of “I learn that science is
about inventing
theories” led to a modification to “I learn that science is about creating theories”.
In some cases, the back-translations appeared more accurate than the original
version, leading to further modifications. For example “I explain my ideas
to other students” was changed to “I explain my understandings to other
students”.
The English version of each scale was tried out with several Australian
grade 7–9 science classes, and this was followed by some of the researchers
interviewing students about the readability and comprehensibility of items and
checking whether students were responding to survey items on the basis intended
by the researchers. Similar interviews were conducted in Taiwan, leading to
some further modifications to survey items. For example, the item “I help the
teacher to decide how much time I spend on activities” was modified to make the
item more explicit, “I help the teacher to decide how much time I spend on
learning activities”.
The CLES and the attitude scale were administered to a sample of 1081
grade 8 and 9 general science students from 50 classes in 25 schools in Western
Australia and 1879 grade 7-9 students from 50 classes in 25 schools in Taiwan.
Of the classes sampled in Western Australia, 38 were selected from within the
metropolitan area of the capital city, Perth, and the remaining 12 classes were
from rural schools. The sample in Taiwan was selected from three areas,
northern Taiwan (Taipei), central Taiwan (Changhua) and southern Taiwan
(Kaohsiung). In Taiwan, 25 classes were biology classes and 25 were physics
classes. In Australia, all 50 classes were general science classes. The samples from both countries were drawn
from government, coeducational schools that could be considered typical and
representative of science classes in each country.
Despite efforts to ensure that the samples were comparable, it is to be
acknowledged that inevitable differences arise when samples are drawn from
quite different educational systems. A fundamental difference, is the different
completion rate in each country. Taiwan has a lower proportion of students who
complete high school than does Australia. In addition, junior high school
science classes in Taiwan teach science as separate strands, (i.e physics or
biology) whereas science classes in Australia are taught as integrated or
‘general’ science. Factors such as these create inherent differences in the
samples, that should be considered when comparing the data.
The quantitative data collected with the surveys were analysed to
provide information regarding the reliability and validity of the surveys in
each country. The data also informed researchers of the differences and
similarities between students’ perceptions in each country, as well as guiding
the collection of qualitative data described below.
Qualitative Data Collection
The data from the surveys were used not only to provide a parsimonious
and economical view of learning environments in each country, but also were
used to guide the collection of qualitative data. Qualitative data were
gathered in each of Australia and Taiwan using classroom observations and
interviews with teachers and students. The collection of qualitative data
enabled researchers to interpret the survey data more meaningfully and provide
richer insights into the results from each country.
Observations were carried out in the classes of four teachers in each
of Australia and Taiwan. The selection of these teachers was based on their
willingness to be involved in the study. At least three students from each of
the eight classes were interviewed about the observations made. They were asked
to comment on various actions that took place during the observations and about
aspects of the classroom environment. In addition, student responses to
selected survey items were used to form part of an interview schedule. Two
items from each scale were selected. The interviews were used to clarify
whether items had been interpreted consistently by students and to help to
explain between-country differences in survey scale means.
The teacher of each of the eight classes was also interviewed. The
interviews sought the teachers’ reasons for various actions and whether the
classroom environments created by different teachers were influenced by
socio-cultural factors.
Findings
From Quantitative Data
Validation of the CLES
Data collected from the 50 classes in Taiwan and the 50 classes in
Australia were analysed in various ways to investigate the reliability and
validity of the CLES in both countries. Principal components factor analysis
followed by varimax rotation confirmed the a priori structure of the instrument
comprising 30 items with 6 items in each of the five scales (see Appendix 1).
Nearly all items had a loading of at least 0.4 on their a priori scale and no other
scale (see Table 1). The percentage of the total variance extracted and
eigenvalue associated with each factor are also recorded at the bottom of Table
1.
Insert Table 1 About Here
Table 2 reports the internal consistency reliability (Cronbach alpha
coefficient) of each of the five six-item scales for two units of analysis
(individual and class mean). Using the class mean as the unit of analysis,
scale reliability estimates ranged from 0.87 to 0.97 in Australia and from 0.79
to 0.98 in Taiwan.
Insert Table 2 About Here
The mean correlation of a scale with other scales was used as a
convenient index of discriminant validity and is reported in Table 2. In
Australia, the mean correlation of a scale with the other scales varied between
0.31 and 0.44 for the individual as the unit of analysis and between 0.37 and
0.60 for the class mean as the unit of analysis. In Taiwan, the mean
correlation of a scale with the other scales varied between 0.32 and 0.42 with
the individual as the unit of analysis and between 0.49 and 0.61 with the class
mean as the unit of analysis.
An analysis of variance (ANOVA) was used to determine the ability of
each CLES scale to differentiate between the perceptions of students in
different classes. The eta2 statistic was calculated to
provide an estimate of the strength of association between class membership and
the dependent variable (CLES scale). Table 2 presents the ANOVA results for
Taiwan and Australia. Each scale differentiated significantly between classes (p<.01)
in both Taiwan and Australia. The amount of variance in scores accounted for by
class membership (i.e. eta2) ranged from 0.14 to 0.18 in Australia and from 0.08 to 0.27 in
Taiwan for different CLES scales.
Analysis of the 10-item Attitude Scale supported its reliability (also
reported in Table 2). The internal consistency reliability (Cronbach alpha
coefficient) for the Australian data was 0.91 for the individual student and
0.96 for the class mean as the unit of analysis, and for the Taiwanese data it
was 0.92 for the individual student and 0.98 for the class mean as the unit of
analysis.
Differences between Australia and Taiwan
In order to investigate the differences and similarities in students’
perceptions of the constructivist approaches present in their science class, we
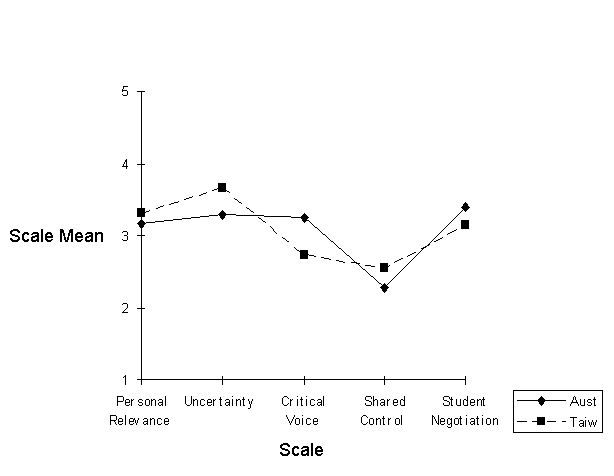
examined the mean scale scores for each country. A plot of the mean scale CLES
scores are reported in Figure 1, which reveals that students from Taiwan
perceived the scales of Personal Relevance, Uncertainty and Shared Control as
occurring more frequently in their science class and that students in Australia
perceived the scales of Critical Voice and Student Negotiation as occurring
more frequently. The mean scores for both countries were close to three
(reported in Table 3), suggesting that each of the constructivist dimensions
measured by the CLES occurs ‘Sometimes’ in each country. The differences
between the mean scores are noteworthy as the larger differences, such as for
Uncertainty and Critical Voice, were more than a standard deviation.
Insert Figure 1 About Here
In order to estimate the magnitude of the differences (in addition to
its statistical significance), effect sizes were calculated as recommended by
Thompson (1998a, 1998b)Effect sizes and t tests were calculated to investigate the
differences between students perceptions in Australia and Taiwan (Table 3). The
effect sizs for each scale of the CLES ranged between approximately a third of
a standard deviation (0.38) and one and two thirds standard deviation (1.76)
for class means. These effect sizes suggest a substantial difference between
countries on all learning environment scales with the possible exception of
Personal Relevance. T tests for independent samples, using the
class as the unit of analysis, were used to investigate whether differences in
scale scores between Australia and Taiwan were statistically significant. The
results showed that there was a statisticaly significant difference (p<.05)
between countries for all five scales of the CLES (see Table 3).
The mean score for the Attitude scale indicates that students in Taiwan
had a more positive attitude towards their science class than did students in
Australia (Table 3). The effect size for student attitudes was approximately
one half of a standard deviation (0.46) for class means, suggesting large
difference between countries. Whilst the results of a t test showed that there was
a significant difference (p<.01)
between the attitudes of students in the two countries.
Insert Table 3 About Here
Overall, the data for students’ perceptions in Taiwan and Australia
would appear to indicate that science classrooms in each country have a similar
overall emphasis on constructivism, although different aspects are emphasised
more or less in each country.
Associations Between Student Attitudes and the Constructivist Learning
Environment
In order to investigate associations between student attitudes and the
five CLES scales in each of Taiwan and Australia, the simple and multiple
correlation analyses shown in Table 4 were conducted. The results of simple
correlation analysis for Taiwan and Australia (Table 4) indicate that all five
of the CLES scales were statistically significantly associated with student
attitudes towards their science class (p< 0.001) at both the individual and
class mean levels of analysis. Correlations between student attitudes and the
CLES scales for Taiwan ranged between 0.27 and 0.51 for the individual as the
unit of analysis and between 0.50 and 0.88 for the class mean. For Australia,
the correlations ranged between 0.27 and 0.50 with the individual as the unit
of analysis and between 0.47 and 0.71 for the class mean. The results of the
simple correlation suggest that improved student attitudes are associated with
more emphasis on all aspects of constructivism assessed by the CLES.
The multiple correlation (R) reported in Table 4, for the set of
five CLES scales in Australia was 0.54 and 0.77, respectively, for the
individual class mean as the unit of analysis. In Taiwan the multiple
correlation was 0.55 and 0.85 for the individual and class mean as the unit of
analysis, respectively. The results were statistically significant (p<0.01)
in all cases. The value of the multiple
correlations for Australia and Taiwan confirms the findings of past studies,
cited by Fraser (1994), that indicate associations between student attitudes
and dimensions of the classroom environment.
To identify which classroom environment scales contribute most to the
variance in student satisfaction, the standardised regression weight (b) were examined (Table 4). When using the individual as the unit of
analysis, three CLES scales were significantly, positively and independently
related to student attitudes when all other scales were mutually controlled (p<0.01)
in both Taiwan and Australia: Personal Relevance, Shared Control and Student
Negotiation. The remaining two scales, Critical Voice and Uncertainty of
Science, appear to have a small and statistically nonsignificant independent
association with student satisfaction.
For the class mean as the unit of analysis, only Personal Relevance was
significantly (p<0.01) and positively related to students’ attitudes.
Insert Table 4 About Here
Overall, the factor structure and internal consistency reliability of
the CLES were supported for the Australian and Taiwanese samples. Whilst the
qualitative data collected in the second phase provide a precautionary note
about the interpretation of data (particularly when making comparisons between
and drawing conclusions from two different countries), the analysis of the
quantitative data for two units of analysis clearly supports the cross-cultural
validity of the CLES.
Findings
From Qualitative Data
The second phase of the study involved the collection of qualitative
data to provide further evidence to support the validity of the CLES and to
determine socio-cultural factors that influence the learning environments in
different countries. Findings related to the qualitative data are reported in
three parts: observations; interviews; and cross-cultural viability of the
CLES.
Observations
Observations took place in four classes in each of Australia and
Taiwan. The observation data revealed that classes in both countries ranged in
the extent to which constructivist approaches were used. In some cases,
particularly those classes where teacher-centred approaches were more apparent,
there appeared to be little, if any, evidence of the use of critical
constructivist pedagogy, whilst in others it was obvious.
During observations, we were able to note examples which illustrated
students’ responses to the CLES. A prime example was for the scale of Student
Negotiation, for which students were asked to indicate how often they have
opportunities to discuss, explain and talk about their learning with other
students. The quantitative data indicated that between-country differences in
mean scale scores for Student Negotiation were statistically significant (Table
3), with Australian students perceiving Student Negotiation as occurring more
often. Observations in both countries confirmed that, in most cases, students
in Australia indeed have more opportunities to discuss ideas and explain their
learning to peers than students in Taiwan, where science classes tend to be
more teacher-centred with fewer opportunities for student negotiation.
Whilst observations supported some of the quantitative data, there were
also some examples for which observations were not consistent with mean scores
obtained from the CLES, such as the for Shared Control. To make meaningful
interpretations of students’ responses to the CLES, we found that it was
necessary to interview students and teachers.
Interviews
At least three students from each of the four classes observed in each
country were interviewed about the observations made. Students were selected
either by the researchers during observations or by the teacher; in both cases,
an attempt was made to select a representative sample (in terms of ability) of
the class. Students were asked to comment on activities that took place during
the observation and student responses to selected survey items were used to
form part of an interview schedule. The interviews were used to identify
aspects of the constructivist learning environment that could not be gleaned
through observations and surveys alone.
Two teachers from each country were also interviewed after observations
of their classes. Based on the observations, the interviews sought explanations
for the teachers’ actions. The interviews provided information regarding a
range of possible influences on the degree to which critical constructivist
pedagogy was employed by the teacher.
During the analysis of the interviews, we identified factors which
could affect students’ responses to the CLES. These were grouped together and
discussed under the following headings: Critical Voice and students’ respect
for the teacher; opportunities for Shared Control and the nature of the
curriculum; competition and Student Negotiation; and student attitude and
Personal Relevance. Finally, the last subsection discusses the viability of the
CLES survey in terms of these influences.
Critical Voice and Students’ Respect for the Teacher
The Critical Voice scale of the CLES measures the degree to which
students are able to question the teacher’s pedagogical plans and methods and
voice their concerns about impediments to their learning. The quantitative data
collected using the CLES (see Figure 1) indicate that students in Taiwan
perceived less Critical Voice in their science classes than did students in
Australia. Interviews with teachers and
students suggested that this dimension of the CLES could be influenced by the
degree of respect which students in each country have for teachers.
Interviews with teachers in Taiwan revealed that they are highly
respected within the community. According to these interviews, teachers in
Taiwan hold a professional status within the community and are respected as
experts in their field. In contrast, teachers in Australia felt that their
position in the community was viewed more as a service than a profession and
has relatively low status.
Interviews from each country suggest that there were also differences
in the ways in which teachers are regarded by students, with students in Taiwan
appearing to have more respect for teachers than students in Australia. During
interviews with students in Taiwan, it was claimed that the teacher's knowledge
was never questioned and the teaching methods or the lesson content were rarely
complained about. It appears that this lack of criticism is reflected in
students’ responses to the Critical Voice scale and such items as “Its OK for
me to question the way I’m being taught.” Students in Taiwan responded to items
as occurring less frequently because generally they do not criticise their
teachers: “The teacher plans the lessons very well. I can’t think of anything
better. ... So, I just listen to what she teaches” (Taiwanese student D, Item
68). Interviews led us to conclude that students preferred to express their
critical voice to peers whom they would question or speak to about problems
after the lesson: “I don’t ask the teacher [questions], I prefer to ask
classmates” (Taiwan Student E, Item 63).
In contrast, the Australian students interviewed were more likely to
complain about their teachers or the teaching methods. Some Australian students
found science lessons boring and would choose to have them taught differently. In these cases (especially for students in
lower-ability classes), students viewed science and their science teachers as
something to be endured because the subject was compulsory. “Science lessons
are boring ... I would prefer to have more experiments” (Australian Student B,
Item 66). These students were more vocal regarding their complaints about the
teacher and other students in the class. They were generally more prepared to
approach the teacher about problems or concerns which they had than were the
students whom we interviewed in Taiwan.
Opportunities for Shared Control and the Nature of the Curriculum
The Shared Control scale of the CLES measures the extent to which
students are invited to share control with the teacher over the design and
management of the learning activities, the determining and applying of
assessment criteria, and the articulation of their own learning goals. Quantitative
data collected using the CLES suggest that students in Taiwan perceived
statistically significantly more (p<0.001) Shared Control in their
science classes than did students in Australia. Observations and interviews
with teachers and students, however, generally did not reflect this result and
revealed that students in Taiwan rarely, if ever, experience Shared Control in
their science classes.
Teachers whom we interviewed in Taiwan revealed that the
examination-driven nature of the curriculum was a major influence on the degree
to which constructivist pedagogy was employed in their science classes. The
science curriculum in Taiwan (for both biology and physics) is presented to
students in the form of textbooks, and examinations are based on the content of
these textbooks. Therefore, it is important for teachers to cover all areas
and, according to teachers' interviews, classes in Taiwan tend to be
teacher-centred to enable them to cover the content of the textbook. Time
constraints allow few diversions and fewer opportunities for students to
exercise control over what they learn.
None of the students whom we interviewed in Taiwan were able to give an
example of when Shared Control occurred in their science class. When asked
about their responses to items related to the Shared Control scale, at least
one third of the students had not understood the items completely. In some
cases, students in Taiwan had interpreted items differently from students in
Australia. For example “I help the teacher to decide how much time I spend on
learning activities” was considered by some Taiwanese students to be an
indication of how fast they would complete set tasks. On the whole, interviews
revealed that students in Taiwan did not expect or want to be involved in lesson
planning. The general consensus of the students whom we interviewed in Taiwan
was that the teacher, as an expert, is more able to make decisions regarding
teaching, planning and evaluation than the student.
It could be argued that Australia also suffers from an
examination-driven curriculum. Generally, however, these pressures usually
appear to be left until senior high school. At the junior high school level,
Australian students are still subject to tests and assessments in the form of
assignments, but not to the same degree as students in Taiwan. Like the science
curriculum in Taiwan, the curriculum in Western Australia also includes set
content that needs to be covered by teachers. Unlike Taiwan, where the content
is defined by a textbook, teachers in Australia have more freedom in the ways
in which they deliver the content. There does not appear to be the same depth
of content that is expected to be covered in Australia and this would appear to
allow teachers more time for alternative teaching methods (such as library
research) and more opportunities to invite students to share control with the
teacher, including the articulation of learning goals and the design of
learning activities. Whilst shared control was not evident in all the classes
that we observed in Australia, there appeared to be more opportunities than in
Taiwan. In addition, most of the students whom we interviewed in Australia were
able to provide examples of shared control in their class even though they had
responded ‘sometimes’ or ‘seldom’ to most items (often indicating that they
would prefer more Shared Control).
The interviews with students’ regarding the Shared Control scale raised
some questions about the applicability of this construct (originally devised in
a Western context) for Taiwan schools. In doing so, they highlight the
importance of combining multiple methods to gain meaningful insights into
students’ responses to a questionnaire.
Student Negotiation and Competition in the Education System
The Student Negotiation scale measures the extent to which
opportunities exist for students to explain and justify to other students their
newly developing ideas and to reflect on the viability of their own and other
students’ ideas. According to the results of the quantitative data collection
(see Table 3), students in Taiwan perceived statistically significantly less
opportunities for negotiation than did students in Australia. Observations and
interviews with students and teachers generally reflect this result. Analysis
of the interviews indicates that the degree of competitiveness in the education
system could be a contributing factor in the amount of student negotiation that
takes place in science classes.
In Taiwan, good examination results are of paramount importance. If
students attain good results, it increases the likelihood of being allocated a
position in a ‘star’ school (a school with outstanding results as measured by
the number of students who enter university). The interviews with teachers in
Taiwan highlighted the competitive nature of teaching. The test scores of the
different classes often were displayed for other teachers to read and teachers
are under a considerable amount of pressure from the principal and home-room
teachers to ensure that grades don’t slip and that students improve their
performance if their results are lower than those of other teachers.
According to teachers in Taiwan, social mobility is available to
students of any status through education. Because the expectation of many
parents is that their child will attend university, they exert pressure on
students to perform well in examinations. According to the teachers whom we
interviewed, the competitive nature of education in Taiwan affects the type of
learning environment that is created. Teaching in Taiwan is often centred on
developing academic ability as efficiently as possible and diversions from
teacher-centred methods can be viewed as off-task by parents and students. The
competitive nature of the education system in Taiwan often forces teachers to
use more teacher-centred methods, thus providing few opportunities for
activities which include student negotiation. In addition, it was felt that, in
terms of academic achievement, teaching methods which are not teacher-centred
could be less effective.
Teachers in Australia did not appear to feel that the education system
in Australia at the junior high school level was as competitive and therefore
students were not under such a great deal of pressure. Student interviews
revealed that the parents of students in the higher-ability classes, such as
the academic extension classes, were more likely to expect their children to
attend university than students in lower-ability classes. Many of the
interviews of students in the lower-ability classes did not indicate that they
aspired to attend university and, for the most part, were interested in
pursuing a career involving a trade such as carpentry. Certainly, teachers in
Australia did not indicate that there was pressure from the parents for
students to succeed in the same way as in Taiwan.
It appears that the reduced competition in Australian schools allows
teachers more time for classroom activities which include opportunities for
student negotiation. Many of the science classes that were observed in
Australia moved away from the teacher-centred lesson that was so prominent in
Taiwan and included various group activities that provided the opportunities
for students to be involved in negotiation at different levels.
Student Attitudes and Personal Relevance
The Personal Relevance scale is concerned with the connectedness of
school science to students’ out-of-school experiences. According to the results
from the CLES, students in Taiwan perceived significantly more personal
relevance in their science classes than did students in Australia. The results
also indicate that students in Taiwan have a significantly more positive
attitude towards their science classes than do students in Australia (see Table
3). Statistically significant associations were found between students’
attitudes and students’ perceptions of the extent to which teachers make the
science program personally relevant to them (Table 4). Interviews with students
and teachers appear to support these data.
Students whom we interviewed in Taiwan generally had a positive
attitude towards their science class. Despite the competitive nature of the
examination-driven curriculum in Taiwan (discussed in the previous two
sections), students felt that teachers go out of their way to make science
classes relevant to their everyday lives. Students gave exmples of teachers
taking the time on weekends to walk in the mountains to help them to learn
biology, or of students helping the teacher to collect specimins from around
the school after class. Teachers whom we interviewed did not consider the
seemingly inflexible curriculum as a barrier to making science relevant and the
students in their class were apparently appreciative of this. “The teacher
always plans interesting lessons that are related to everyday life” (Taiwan
Student F, Item 68) “Most of the content of biology [that she teaches us] is
about everyday life, and so we find it useful” (Taiwan Student D, Item 63).
The interviews of the students in Australia indicate that their
attitude towards science classes could depend on their ability level. Unlike
Taiwan, where junior high schools students generally are randomly allocated to
classes, many schools in Western Australia ‘stream’ students according to
ability. This varies in different schools, with higher-ability students being
placed in academic extension classes in some cases, with student selection of
subjects dictating the classes which the students attend in other cases, and
with schools randomly selecting students in still other cases.
Students whom we interviewed in higher-ability classes appeared to have
more positive attitudes towards their science class than students in
lower-ability classes. The interviews suggest that students in higher-ability
classes were more likely to be given activities that students refer to as
‘enjoyable’, such as experiments or investigations conducted outside the
classroom (which they also agreed made science more meaningful). In contrast,
students in the lower-ability classes were inclined to find science lessons boring
and unnecessary for their future.
Cross-Cultural
Viability of the CLES
The interviews with students from Taiwan and Australia helped us to
interpret the quantitative data. Through these interviews, it was possible to
ascertain the reasons for students’ responses to survey items and their
feelings about various aspects of their classroom environment. During this
process, the interviews highlighted the strong points and pitfalls associated
with using a survey framed in a Western context in a different culture.
Students’ interviews were generally reflective of their perceptions as
described by the CLES, with the exception of the Shared Control scale.
Therefore, the survey data provided a good starting point for measuring
students’ perceptions of the constructivist learning environment in both
countries.
One pitfall which was highlighted through students’ interviews was
that, despite the accuracy of the back translations, the Chinese version of the
survey did not always capture the full or literal meaning of the original
survey. In some cases, the survey items were outside the realm of students'
experience, as with the item “I help the teacher to decide how much time I
spend on learning experiences”. Some Taiwanese students had never been involved
in class decision-making in the Western sense, and therefore interpreted the
item to involve the speed with which they completed set tasks. An important
point which emerged was that students were unlikely to be able to describe,
with any degree of accuracy, a dimension of the classroom environment with
which they have had no experience. Shared control was one such concept with
which many students were unfamiliar and therefore they interpreted items
differently from those students who had experienced shared control.
At the end of gathering the qualitative data, two important points
emerged for the researchers from both countries. Firstly, whilst the classroom
environments are different in the two countries, CLES scores do not necessarily
reflect the overall quality of education. Students in Taiwan perceived that the
activities encompassed by the scales Critical Voice and Student Negotiation
occurred less frequently than did their Australian counterparts. In a Western
sense, this could be considered as ‘less favourable’ perceptions of scales, but
this has to be considered in terms of the survey and whether the scales reflect
what is considered to be educationally important in the countries and cultures
where the data were collected. Secondly, comparisons of quantitative data from
different countries should be made with caution because we found that there
were some items for which students in one country consistently interpreted
items slightly differently from those in another country (as with the Shared
Control scale).
Discussion and Conclusions
This cross-national study of science classroom environments in Taiwan
and Australia combined quantitative and qualitative methods. The quantitative
data, collected using the Constructivist Learning Environment Survey (CLES),
supported the reliability and validity of both an English and Mandarin version.
The a
priori factor structure was replicated with nearly all items loading
on their own factor and no other factor. Internal consistency (Cronbach alpha
coefficient) for two units of analysis, ability to differentiate between
classrooms and discriminant validity were found to be acceptable.
A comparison of CLES scale mean scores in two countries revealed that
Australian students perceived more Critical Voice and Student Negotiation and
less Personal Relevance, Uncertainty and Shared Control than students in
Taiwan. Also, the attitudes of Taiwanese students towards their science classes
were more positive than for students in Australia.
Simple correlations revealed that a positive and statistically
significant correlation between students’ attitudes and each of the five scales
of the CLES for both Taiwan and Australian data. A multiple regression revealed
positive and statistically significant independent associations between
attitude, Personal Relevance, Shared Control and Student Negotiation for both
Australia and Taiwan with the individual as the unit of analysis.
In a second phase of the study, data were collected through classroom
observations and interviews with students and teachers in each country. This
qualitative information was used to help make meaningful interpretations of
quantitative data by taking into account the background, culture and situation
of individuals.
Whilst initially observations appeared to conflict with some of the
quantitative data, interviews helped the researchers to make sense of these
incongruencies. In some cases, the qualitative data supported the quantitative
data. Australian students perceived Critical Voice and Student Negotiation as
occurring more often than Taiwanese students and interviews and observations
confirmed that this was generally the case. We found, however, that there were
cultural factors which affected responses to these scales. For example,
students in Taiwan appeared to have a higher regard for their teachers than did
Australian students and were therefore less likely to criticise them. We also
found that students in Taiwan were more likely to include instances outside the
science class (such as discussions with peers for the Student Negotiation
scale) which could have increased the mean score for this scale.
Students in Taiwan indicated that the Personal Relevance scale occurred
more frequently than did students in Australia. Interviews revealed that this
could, in part, be due to students’ attitude towards science. Students in
Taiwan generally agreed that science was required for their future and felt
that their teachers went out of their way to ensure that lessons were relevant
to their everyday life. In contrast, Australian students, particularly those in
lower-ability classes, felt that science classes were less relevant to their
out-of-school life.
Quantitative data indicated that Shared Control occurred more
frequently in Taiwan than Australia. This was not reflected in the qualitative
data and interviews revealed that many students in Taiwan had not experienced
shared control as expressed in the CLES. Students’ interpretations of items
were, therefore, more likely to differ to those of the Australian students.
This was a poignant factor that researchers felt noteworthy, as it serves as a
reminder that quantitative data on its own can be open to misinterpretation.
By combining qualitative and quantitative data, it was possible to
determine not only that the learning environments in each country were
different, but also some explanations of why they were different. It was found
that, by weaving survey data with observations and interviews collected from
the participants, we could gain a more complete picture and better explain
differences and similarities between scale scores of the two countries.
Interviews with teachers, students and researchers revealed that the
CLES has proven to be a useful method for providing important insights into the
key characteristics of teaching epistemologies in science classes in both
Taiwan and Australia. As such, this study suggests that the CLES is a useful
tool for examining the transformation of teaching and learning practices in
accordance with a constructivist perspective.
The findings provide a precautionary note regarding the use of surveys
framed in a Western context. The interpretation of data which measures
constructivist approaches from a Western viewpoint, could be limited if
socio-cultural factors are not considered. Hence, comparisons of the results of
surveys administered in different countries should be done with caution.
References
Brislin, R.
W., 1983, Cross-cultural research in psychology. Annual Review of Psychology,
34,
363-400.
Burden, R. L.,
& Fraser, B. J., 1993, Use of classroom environment assessments in school
psychology: a British perspective. Psychology in the Schools, 30,
232-240.
Fisher, D. L.,
& Fraser, B. J., 1983, A comparison of actual and preferred classroom
environments as perceived by science teachers and students. Journal of
Research in Science Teaching, 20, 55-61.
Fraser, B. J.,
1981, Test
of science-related attitudes handbook (TOSRA) (Melbourne,
Australia: Australian Council for Educational Research).
Fraser, B. J.,
1986, Classroom
environment (London: Croom Helm).
Fraser, B. J.,
1993, Incorporating classroom and school environment ideas into teacher
education programs. In T. A. Simpson (ed.), Teacher educators’ annual handbook 1993
(Brisbane, Australia: Queensland University of Technology), 135-152.
Fraser, B. J.,
1994, Research on classroom and school climate. In D. Gabel (Ed.), Handbook of
research on science teaching and learning (New York: Macmillan),
493-541.
Fraser, B. J.,
1996a, NARST’s expansion, internationalization and cross-nationalization:
History in the making. Presidential address at the annual meeting of the
National Association for Research in Science Teaching (St Louis, MO).
Fraser, B. J.,
1996b, Grain sizes in educational research: Combining qualitative and
quantitative methods. Paper presented at the seminar on Research Methods in the
Study of Science Classroom Environments (Taipei, Taiwan).
Fraser, B. J.,
1998, Science learning environments: assessment, effects and determinants. In
B. J. Fraser and K. G. Tobin (eds.), The international handbook of science education (Dordrecht,
The Netherlands: Kluwer Academic Publishers), 527-564.
Fraser, B. J.,
Dryden, M., & Taylor, P. C., 1998, April, The impact of systemic reform
efforts on instruction in high school science classes. Paper presented at the
annual meeting of the National Association for Research in Science Teaching
(San Diego, CA).
Fraser, B. J.,
& Fisher, D. L., 1983, Use of actual and preferred classroom environment
scales in person-environment fit research. Journal of Educational Psychology, 75,
303-313.
Fraser, B. J.,
& Fisher, D. L., 1986, Using short forms of classroom climate instruments
to assess and improve classroom psychosocial environment. Journal of Research in Science Teaching,
5,
387-413.
Fraser, B. J.
& Tobin, K., 1991, Combining qualitative and quantitative methods in
classroom environment research. In B. J. Fraser & H. J. Walberg (eds.), Educational
environments: Evaluation, antecedents and consequences (London:
Pergamon), 271-292.
Fraser, B. J.
& Walberg, H. J. (Eds.). (1991). Educational environments: Evaluation, antecedents and
consequences. London: Pergamon.
Lucas, K. B.,
& Roth, W.-M., 1996, The nature of scientific knowledge and student
learning: Two longitudinal case studies. Research in Science Education, 26, 103-129.
McRobbie, C.
J., & Ellett, C. D. (Guest Editors), 1997, Advances in research on
educational learning environments. International Journal of Educational Research,
27(4),
267-354 (whole issue).
Roth, W.-M.,
& Bowen, G. M., 1995, Knowing and interacting: a study of culture,
practices, and resources in a grade 8 open-inquiry science classroom guided by
a cognitive apprenticeship metaphor. Cognition and Instruction, 13, 73-128.
Stigler, J.
W., & Hiebert, J., 1997, Understanding and improving classroom mathematics
instruction: an overview of the TIMSS video study. Phi Delta Kappan, 79 (1),
14-21.
Taylor, P. C.,
1994, Collaborating to reconstruct teaching: The influence of researcher
beliefs. In K Tobin (ed.), The practice of constructivism in science education (Hillsdale,
NJ: Lawrence Erlbaum), 267-298.
Taylor, P. C.,
1996, Mythmaking and mythbreaking in the mathematics classroom.
Educational Studies in Mathematics, 31, 151-173.
Taylor, P. C.,
Dawson, V., & Fraser, B. J., 1995a, Classroom learning environments under
transformation: A constructivist perspective. Paper presented at the annual
meeting of the American Educational Research Association (San Francisco, CA).
Taylor, P. C.,
Dawson, V., & Fraser, B. J., 1995b, A constructivist perspective on monitoring
learning environments under transformation. Paper presented at the annual
meeting of the American Educational Research Association (San Francisco, CA).
Taylor, P. C.,
& Fraser, B. J., 1991, Development of an instrument for assessing
constructivist learning environments. Paper presented at the annual meeting of
the American Educational Research Association (New Orleans, LA).
Taylor, P. C.,
Fraser, B. J., & Fisher, D. L., 1997, Monitoring constructivist classroom
learning environments. International Journal of Educational Research, 27,
293-302.
Taylor, P. C.,
Fraser, B. J., & White, L. R., 1994, The revised CLES: A questionnaire for
educators interested in the constructivist reform of school science and
mathematics. Paper presented at the annual meeting of the American Educational
Research Association (Atlanta, GA).
Thompson, B.,
1998a, Review of ‘what if there were no significance tests?’. Educational
and Psychlogical Measurement, 58(2), 334-346.
Thompson, B.,
1998b, Five methodology errors in educational research: The pantheon of
statistical significance and other faux pas. Invited address presented at the annual
meeting ot the American Educational Research Association, San Diego.
Tobin, K.,
& Fraser, B. J. (eds.), 1998, Qualitative and quantitative landscapes of
classroom learning environments. In B. J. Fraser and K. G. Tobin (eds.), The
international handbook of science education (Dordrecht, The
Netherlands: Kluwer Academic Publishers) 623-640.
Tobin, K.,
Kahle, J. B., & Fraser, B. J. (eds.), 1990, Windows into science classes: Problems
associated with higher-level cognitive learning (London: Falmer
Press).
Watters, J.
J., & Ginns, I. S., 1994, Self-efficacy and science anxiety among
preservice primary teachers: Origins and remedies. Research in Science Education, 24,
348-357.
Wubbels, Th., & Levy, J. (eds.), 1993, Do you know
what you look like?: Interpersonal relationships in education
(London: Falmer Press).